Method for plotting linear models
ggplot.lm.RdSimple method to plot a linear model using ggplot along with 95
# S3 method for lm
ggplot(data, mapping, vars, ...)
Arguments
| data | The linear model object from |
|---|---|
| mapping | Regular mapping, see |
| vars | A list of variable values used for prediction. |
| ... | Additional arguments passed to |
Value
A ggplot class object.
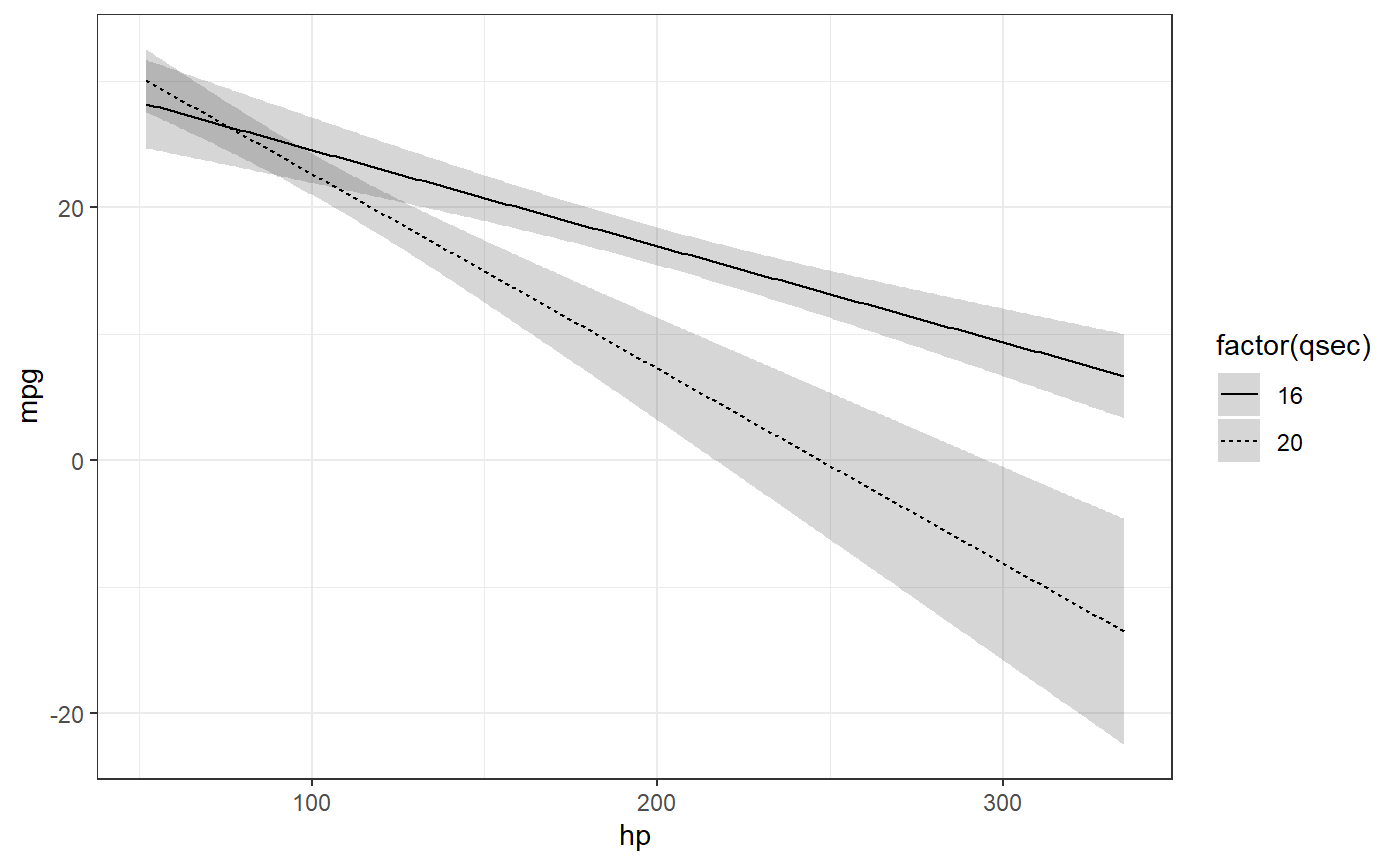
Examples
ggplot2::ggplot(
  lm(mpg ~ hp * qsec, data = mtcars),
  ggplot2::aes(hp, mpg, linetype = factor(qsec)),
  vars = list(
    hp = min(mtcars$hp):max(mtcars$hp),
    qsec = round(mean(mtcars$qsec) + c(-1, 1) * sd(mtcars$qsec)), 1)) +
  ggplot2::geom_ribbon(ggplot2::aes(ymin = LL, ymax = UL), alpha = .2) +
  ggplot2::geom_line() +
  ggplot2::theme_bw()