Function to plot data and mean summary
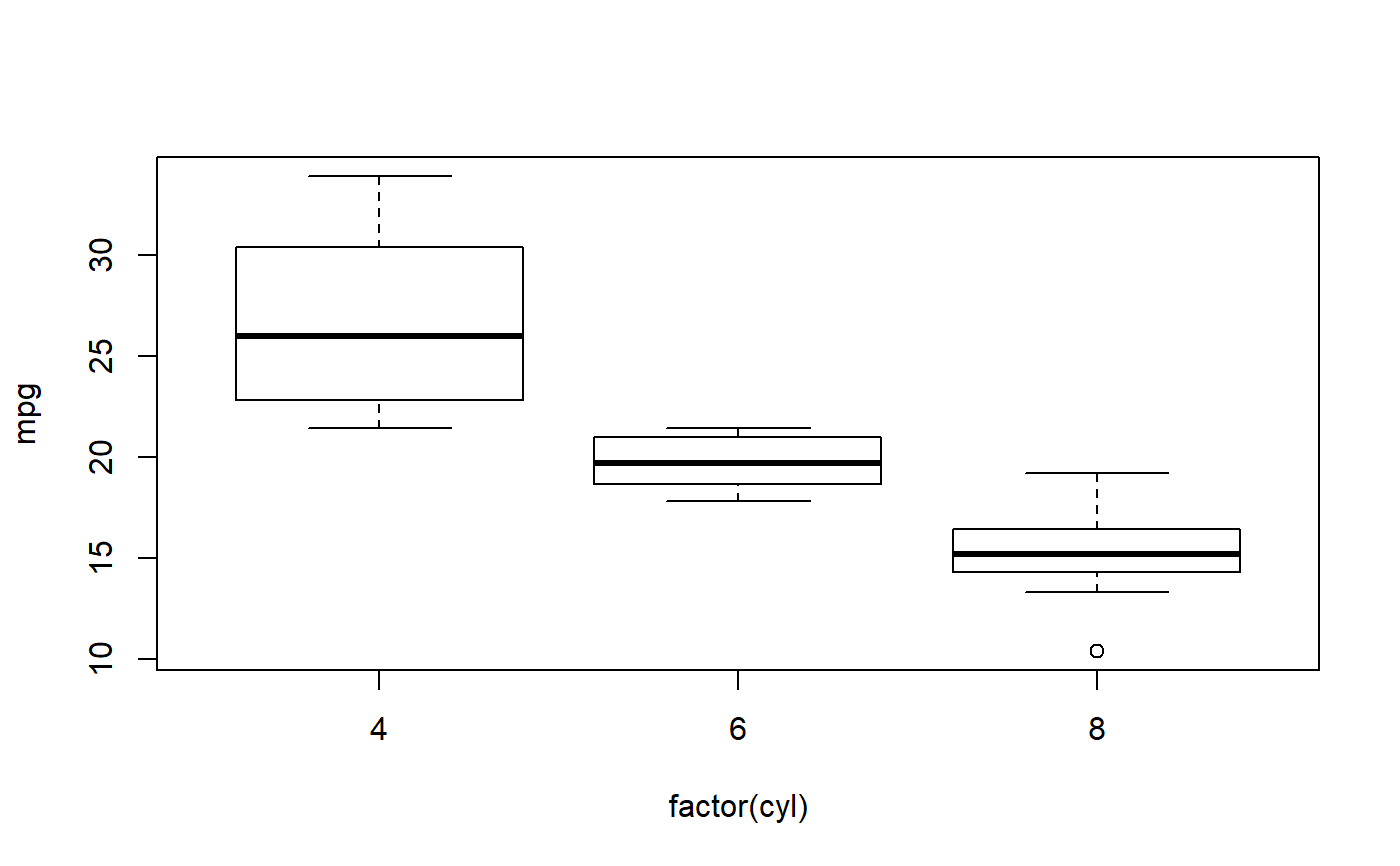
meanPlot.RdThis is a simple function designed to facilitate plotting raw data along with dots indicating the mean at each x-axis value.
meanPlot(formula, d)
Arguments
| formula | A formula specifying the variable to be used on the y-axis and the variable to be used on the x-axis. |
|---|---|
| d | A data.frame class object containing the variables specified
in the |
Value
Called for the side effect of creating a plot.
Details
Although this function can be used with any type of data that works
with plot, it works best when the x-axis values are discrete,
so that there are several y-values at the same x-axis value so that
the mean of multiple values is taken.