Plots SEMSummary object
Usage
# S3 method for class 'SEMSummary'
plot(x, y, ...)Examples
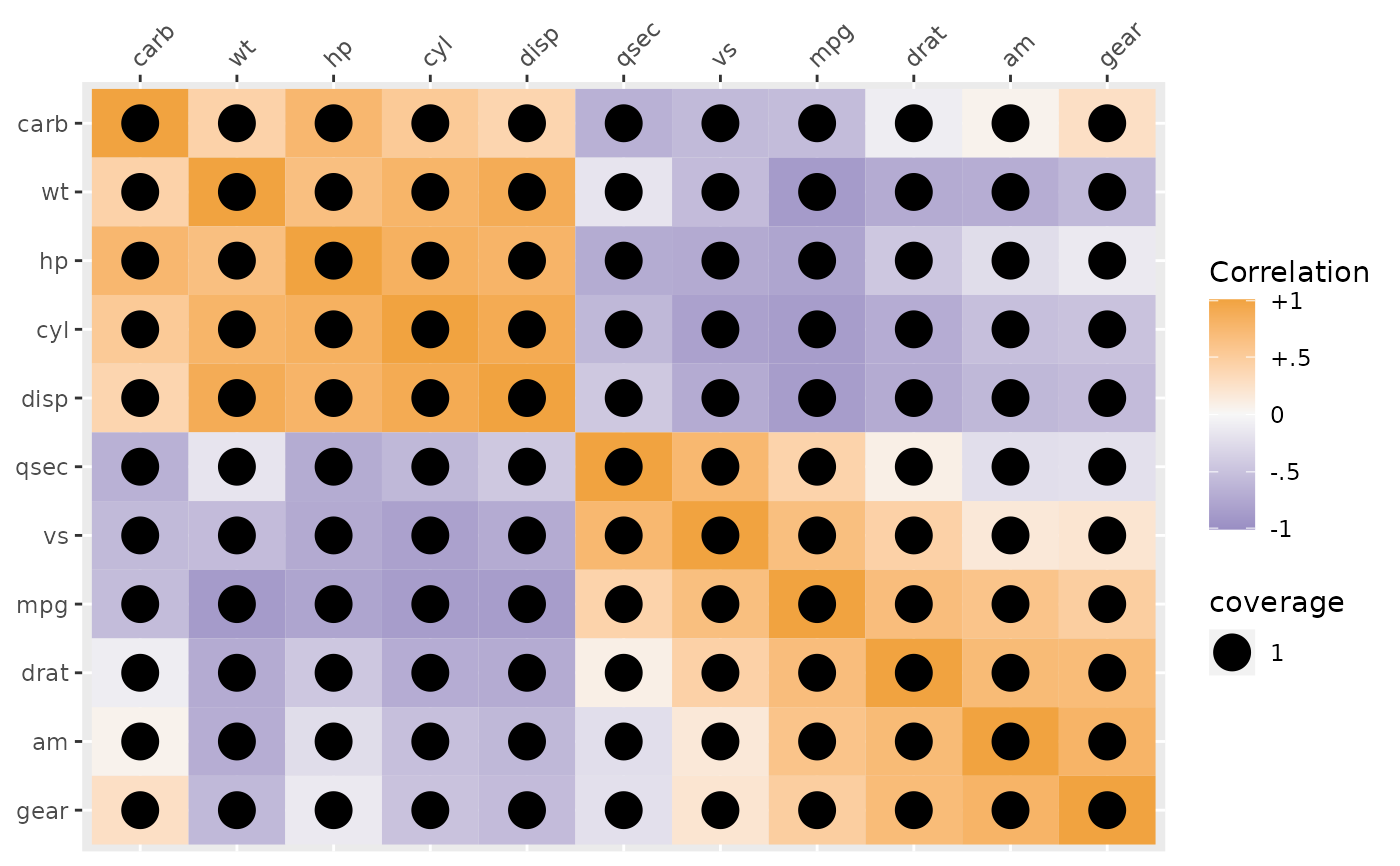
# default plot
plot(SEMSummary(~ ., data = mtcars))
 # same as default
plot(SEMSummary(~ ., data = mtcars), type = "coverage")
# same as default
plot(SEMSummary(~ ., data = mtcars), type = "coverage")
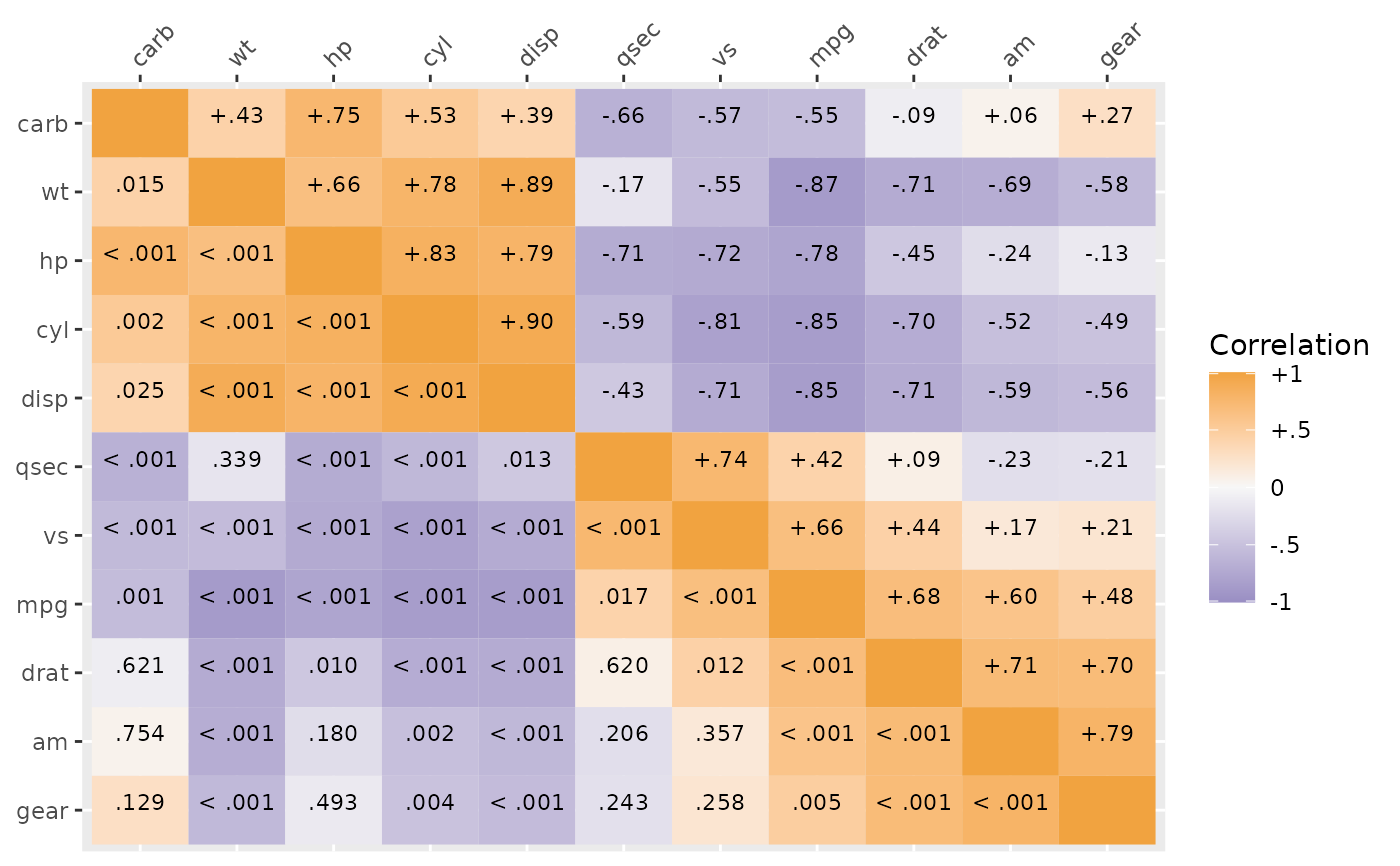
 # shows p values
plot(SEMSummary(~ ., data = mtcars), type = "p")
# shows p values
plot(SEMSummary(~ ., data = mtcars), type = "p")
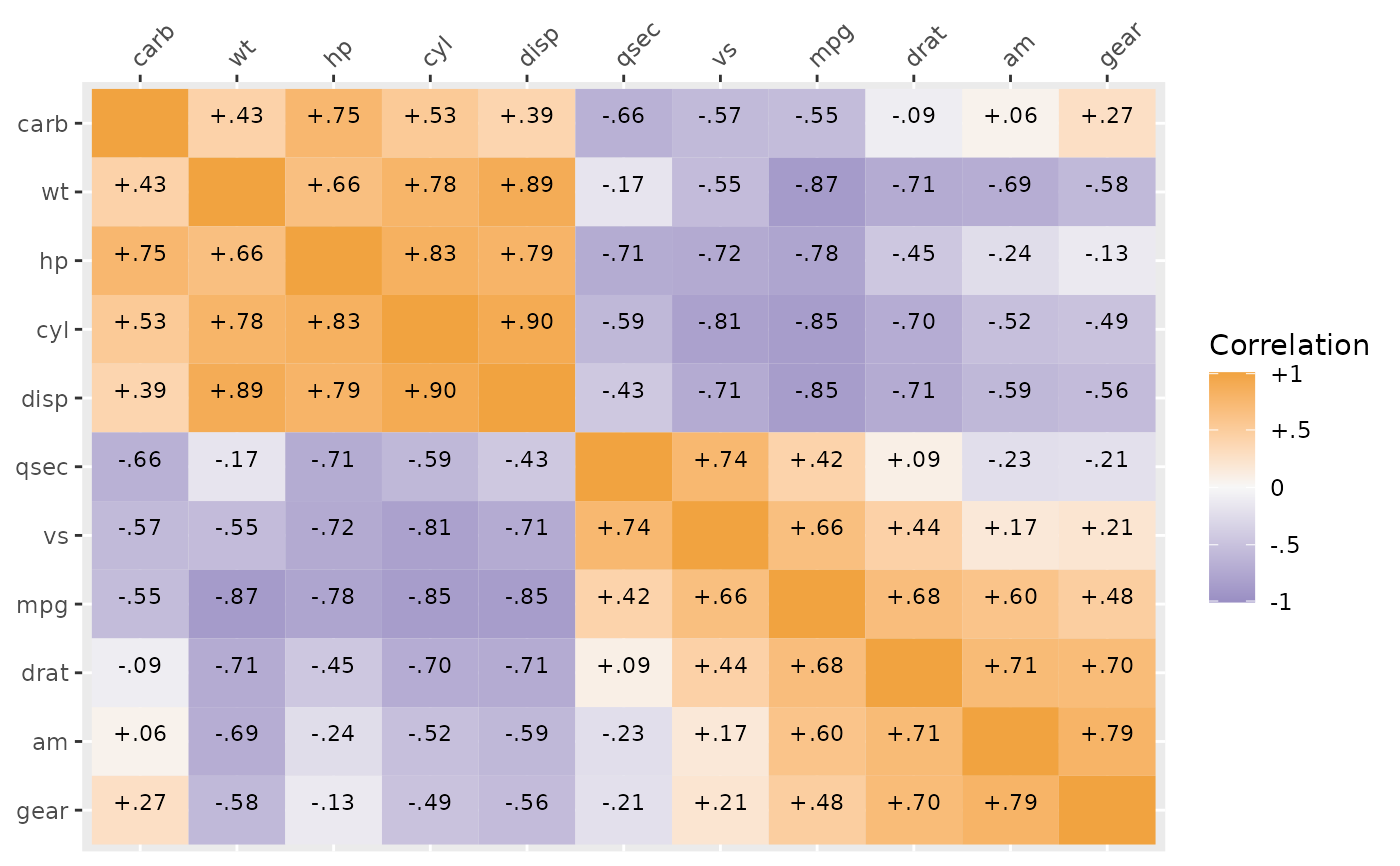
 # shows correlations
plot(SEMSummary(~ ., data = mtcars), type = "cor")
# shows correlations
plot(SEMSummary(~ ., data = mtcars), type = "cor")