Plots SEMSummary.list object
Usage
# S3 method for class 'SEMSummary.list'
plot(x, y, which, plot = TRUE, ...)
Arguments
- x
An object of class SEMSummary.list.
- y
Ignored
- which
either a numeric vector based on the positions, or a character vector giving the names of the levels of the list to plot.
- plot
A logical, whether to actually plot the results or not. Defaults to
TRUE.- ...
Additional arguments passed on to the real workhorse,
corplot.
Examples
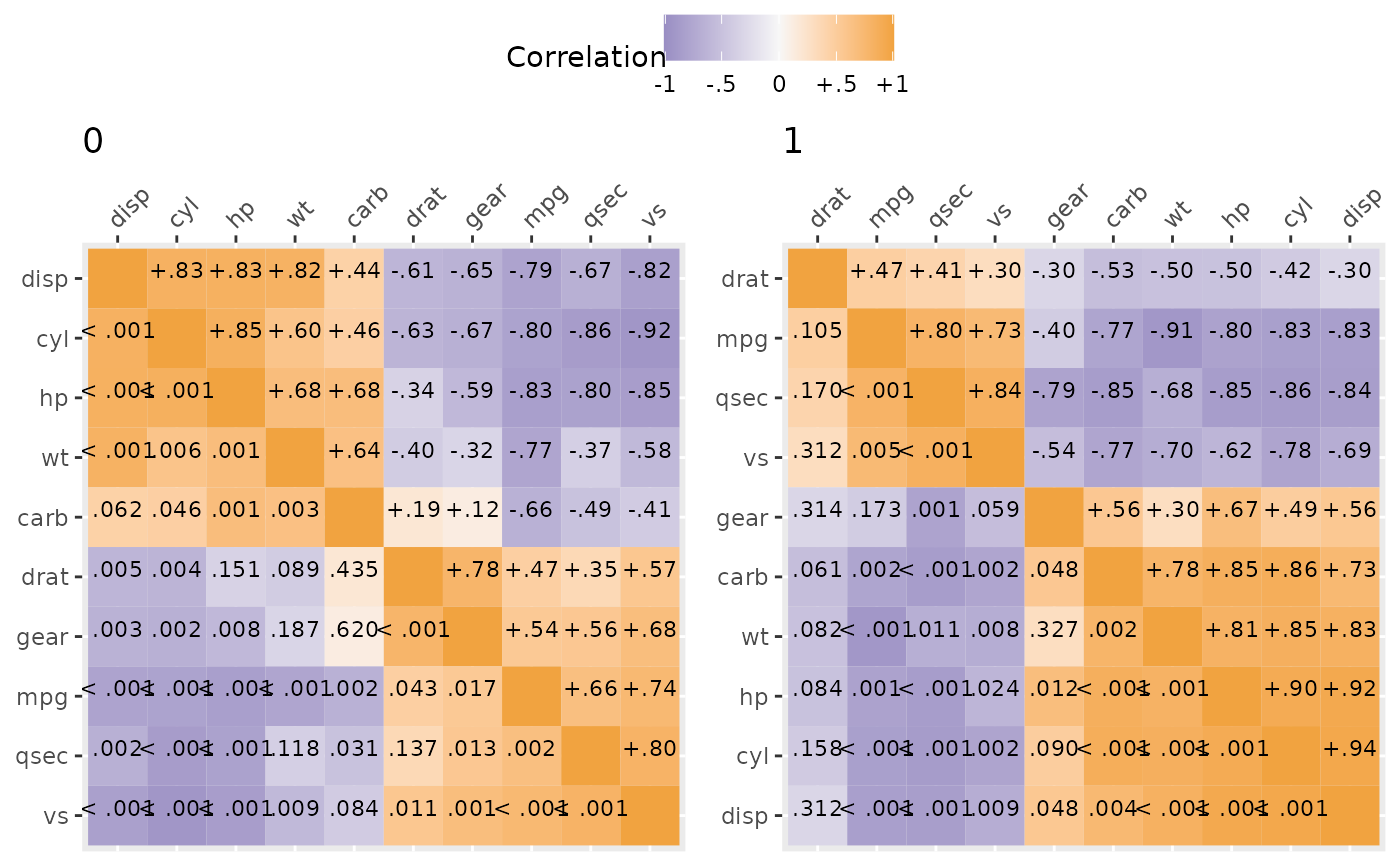
## correlation matrix by am level
plot(SEMSummary(~ . | am, data = mtcars))