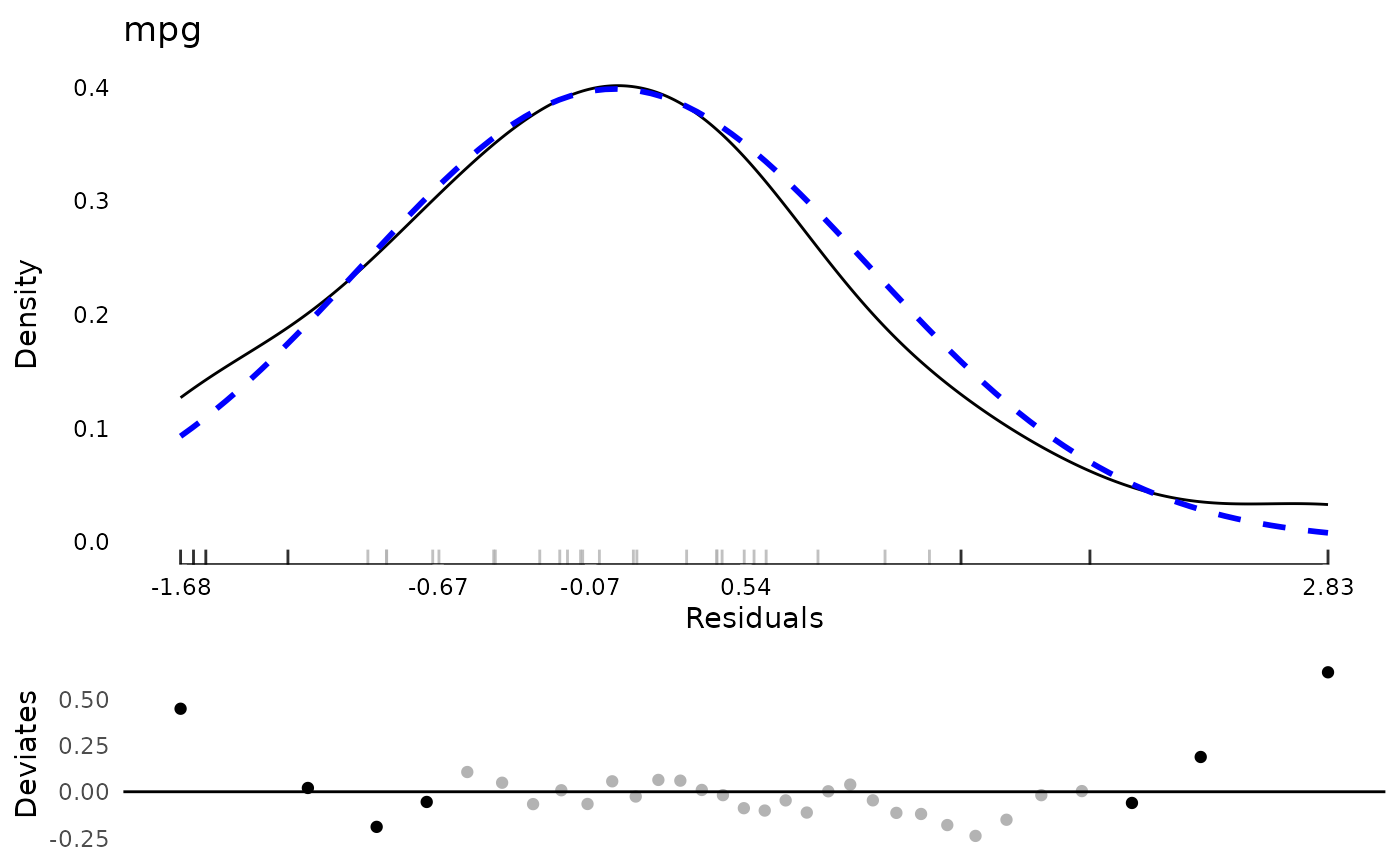
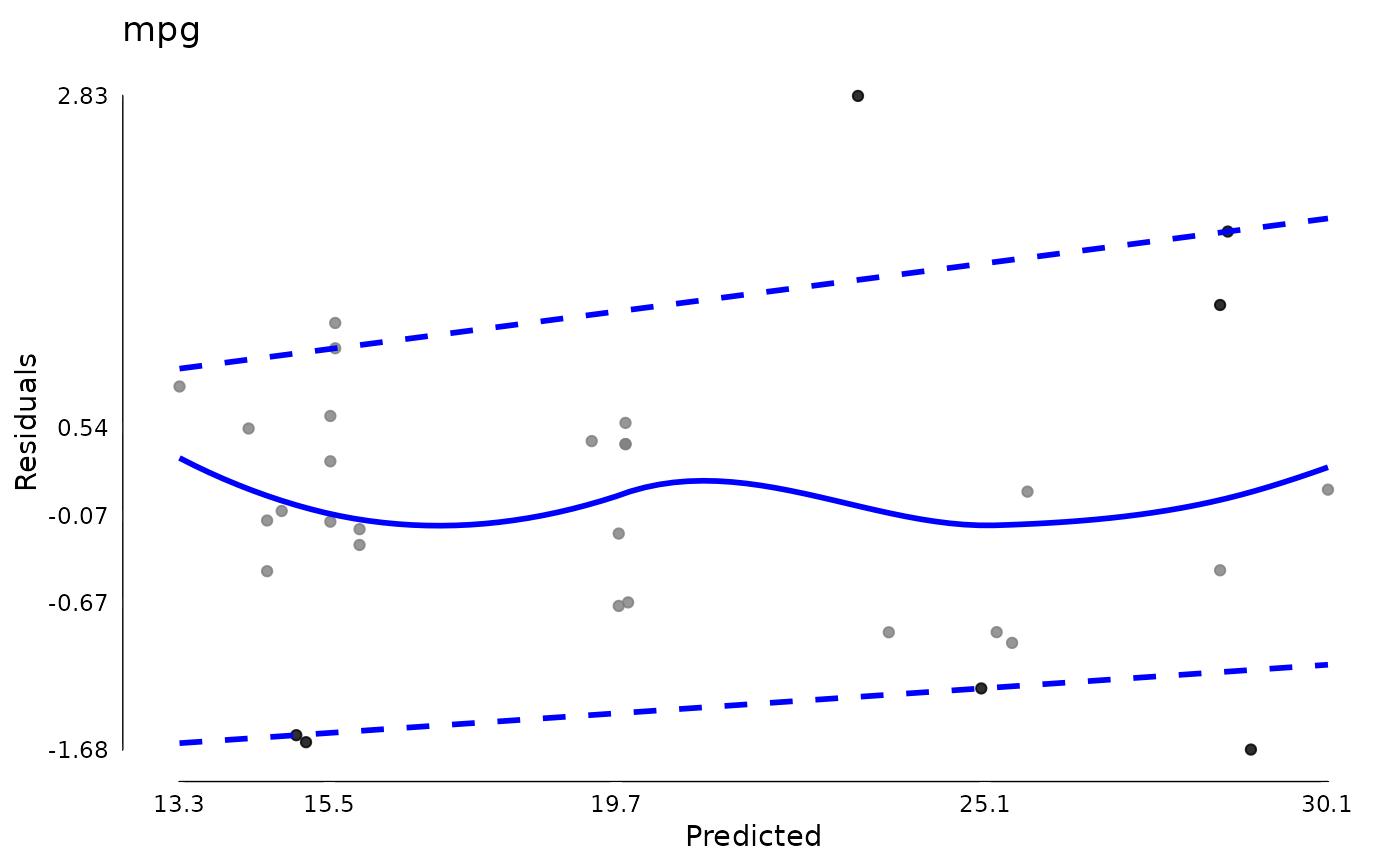
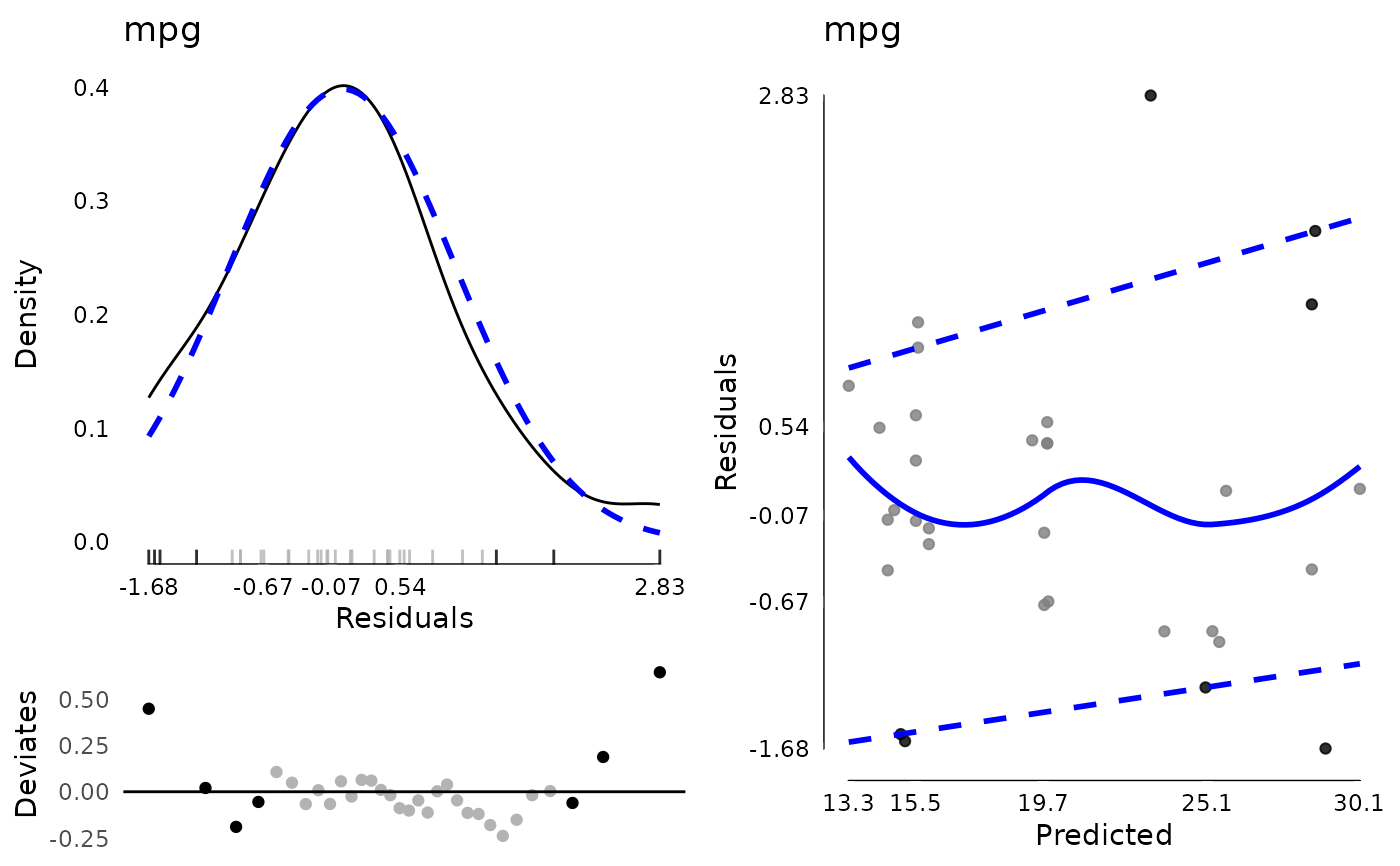
This function creates a number of diagnostic plots from lm models.
Usage
# S3 method for class 'modelDiagnostics.lm'
plot(x, y, plot = TRUE, ask = TRUE, ncol, ...)
Arguments
- x
A
modelDiagnosticsclass object from lm.- y
Included to match the generic. Not used.
- plot
A logical value whether or not to plot the results or simply return the graaphical objects.
- ask
A logical whether to ask before changing plots. Only applies to interactive environments.
- ncol
The number of columns to use for plots. Missing by default which means individual plots are created. If specified, plots are put together in a grid.
- ...
Included to match the generic. Not used.