A set of functions to calculate
residual diagnostics on models, including constructors,
a generic function, a test of whether an object is of the
residualDiagnostics class, and methods.
Usage
residualDiagnostics(object, ...)

as.residualDiagnostics(x)

is.residualDiagnostics(x)

# S3 method for class 'lm'
residualDiagnostics(
  object,
  ev.perc = 0.001,
  robust = FALSE,
  distr = "normal",
  standardized = TRUE,
  cut = 8L,
  quantiles = TRUE,
  ...
)
Arguments
- object
A fitted model object, with methods for
model.frame,residandfitted.- ...
Additional arguments passed to methods.
- x
A object (e.g., list or a modelDiagnostics object) to test or attempt coercing to a residualDiagnostics object.
- ev.perc
A real number between 0 and 1 indicating the proportion of the theoretical distribution beyond which values are considered extreme values (possible outliers). Defaults to .001.
- robust
Whether to use robust mean and standard deviation estimates for normal distribution
- distr
A character string given the assumed distribution. Passed on to
testDistribution. Defaults to “normal”.- standardized
A logical whether to use standardized residuals. Defaults to
TRUEgenerally where possible but may depend on method.- cut
An integer, how many unique predicted values there have to be at least for predicted values to be treated continuously, otherwise they are treated as discrete values. Defaults to 8.
- quantiles
A logical whether to calculate quantiles for the residuals. Defaults to
TRUE. IfFALSE, then do not calculate them. These are based on simple quantiles for each predicted value if the predicted values are few enough to be treated discretely. Seecutargument. Otherwise they are based on quantile regression. First trying smoothing splines, and falling back to linear quantil regression if the splines fail. You may also want to turn these off if they are not working well, or are not of value in your diagnostics.
Value
A logical (is.residualDiagnostics) or
a residualDiagnostics object (list) for
as.residualDiagnostics and residualDiagnostics.
Examples
testm <- stats::lm(mpg ~ hp * factor(cyl), data = mtcars)

resm <- residualDiagnostics(testm)
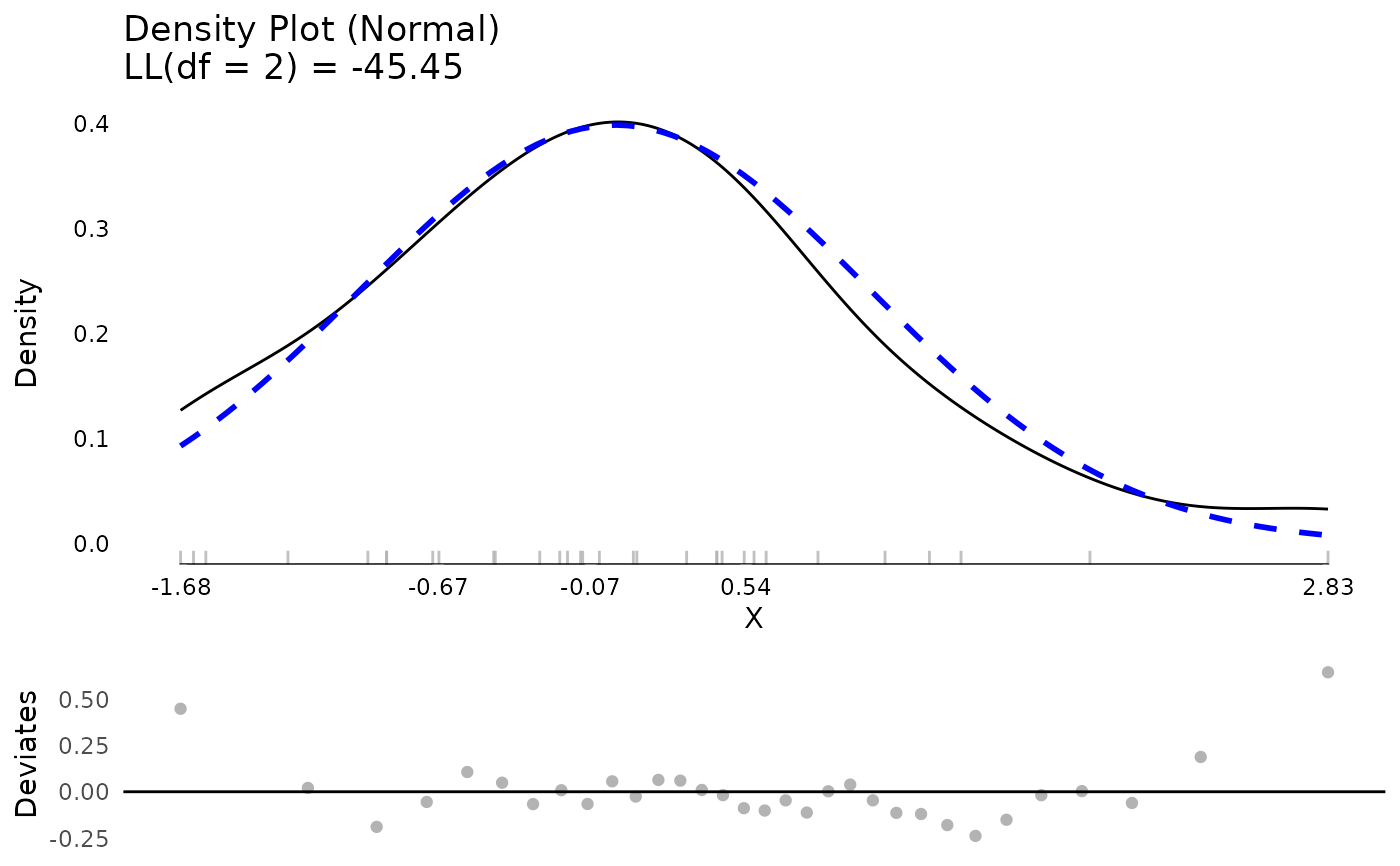
plot(resm$testDistribution)


resm <- residualDiagnostics(testm, standardized = FALSE)
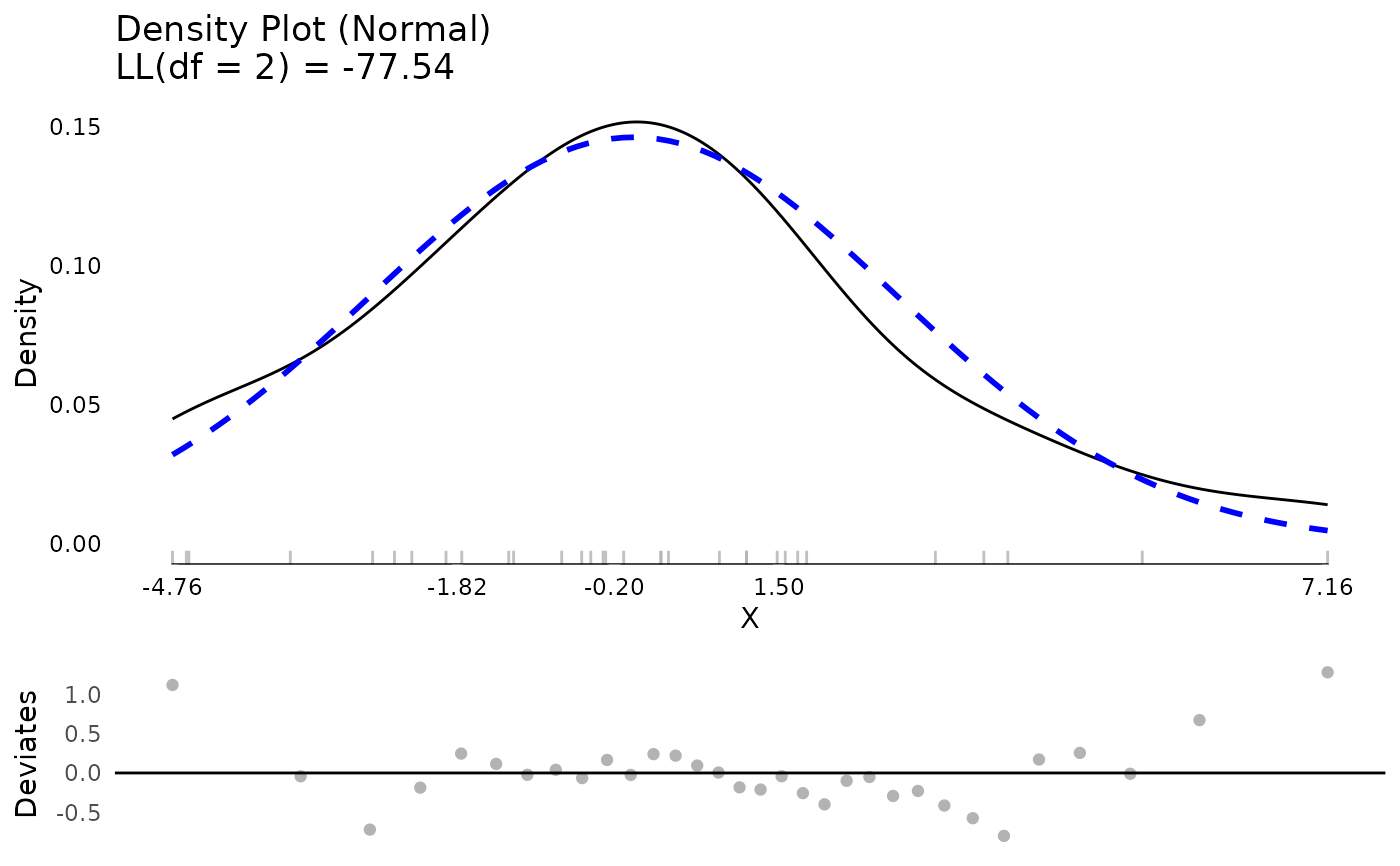
plot(resm$testDistribution)


## clean up
rm(testm, resm)
if (FALSE) { # \dontrun{

testdat <- data.frame(
  y = c(1, 2, 2, 3, 3, NA, 9000000, 2, 2, 1),
  x = c(1, 2, 3, 4, 5, 6, 5, 4, 3, 2))

residualDiagnostics(
  lm(y ~ x, data = testdat, na.action = "na.omit"),
  ev.perc = .1)$Residuals

residualDiagnostics(
  lm(y ~ x, data = testdat, na.action = "na.exclude"),
  ev.perc = .1)$Residuals

residualDiagnostics(
  lm(sqrt(mpg) ~ hp, data = mtcars, na.action = "na.omit"),
  ev.perc = .1)$Residuals
} # }