This function estimates the simple moving average for a specific window and weights it with a variety of optional decays (e.g., exponential, linear, none). Whether to omit missing data or not is based on the missing threshold, which is a proportion and indicates the tolerance. If the weighted proportion missing exceeds this threshold, then that observation is missing, otherwise, missing data are excluded and the weighted simple moving average calculated on the non missing data.
Usage
weighted.sma(
  x,
  window,
  decay = c("exponential", "linear", "none"),
  alpha,
  missThreshold = 0
)
Arguments
- x
Time series data on which to calculate the weighted simple moving average. It is assumed that these data are in the correct order and that time is equally spaced. Any missing data should be filled in with NAs.
- window
An integer indicating the size of the window to use. This window will include the current value.
- decay
A character string indicating the type of decay to use on the weights.
- alpha
An optional value. Not needed for
decay= “none”, but it is required for the exponential and linear decay. For exponential and linear decay, alpha should range between 0 and 1. 0 will result in no decay.- missThreshold
A numeric value indicating the proportion of data that can be missing for a given window before the resulting simple moving average is set to missing. This is a proportion of the weighted data, so not all data points will necessarily be equally weighted.
Examples
dweights <- expand.grid(
time = 0:10,
alpha = seq(0, 1, by = .1))
library(ggplot2)
ggplot(dweights, aes(time, (1 - alpha)^time, colour = factor(alpha))) +
geom_line() + geom_point() + theme_bw() +
scale_x_reverse() +
theme(legend.position = "bottom") +
ggtitle("Exponential Decay in Weights")
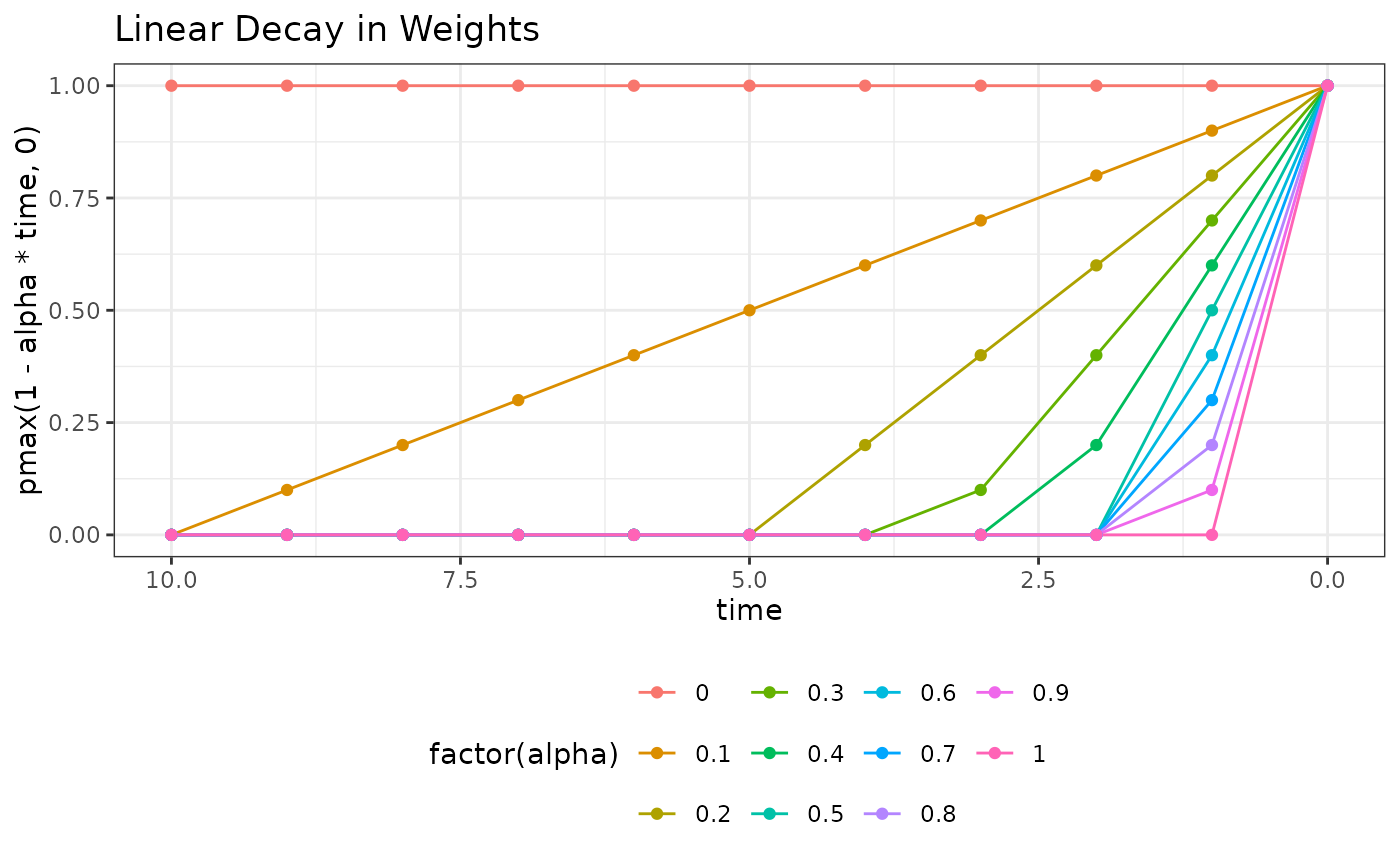
 ggplot(dweights, aes(time, pmax(1 - alpha * time, 0), colour = factor(alpha))) +
geom_line() + geom_point() + theme_bw() +
scale_x_reverse() +
theme(legend.position = "bottom") +
ggtitle("Linear Decay in Weights")
ggplot(dweights, aes(time, pmax(1 - alpha * time, 0), colour = factor(alpha))) +
geom_line() + geom_point() + theme_bw() +
scale_x_reverse() +
theme(legend.position = "bottom") +
ggtitle("Linear Decay in Weights")
 weighted.sma(c(1, 2, 3, 4, 5),
window = 3L, decay = "none",
missThreshold = 0)
#> [1] NA NA 2 3 4
weighted.sma(c(1, 2, 3, 4, 5),
window = 3L, decay = "exponential",
alpha = 0, missThreshold = 0)
#> [1] NA NA 2 3 4
weighted.sma(c(1, 2, 3, 4, 5),
window = 3L, decay = "linear",
alpha = 0, missThreshold = 0)
#> [1] NA NA 2 3 4
weighted.sma(c(1, 2, 3, 4, 5),
window = 3L, decay = "exponential",
alpha = .1, missThreshold = 0)
#> [1] NA NA 2.070111 3.070111 4.070111
weighted.sma(c(1, 2, 3, 4, 5),
window = 3L, decay = "exponential",
alpha = .5, missThreshold = 0)
#> [1] NA NA 2.428571 3.428571 4.428571
weighted.sma(c(1, 2, 3, 4, 5),
window = 3L, decay = "linear",
alpha = .1, missThreshold = 0)
#> [1] NA NA 2.074074 3.074074 4.074074
weighted.sma(c(1, 2, 3, 4, 5),
window = 3L, decay = "linear",
alpha = .3, missThreshold = 0)
#> [1] NA NA 2.285714 3.285714 4.285714
weighted.sma(c(1, NA, NA, 4, 5),
window = 4L, decay = "exponential",
alpha = .4, missThreshold = .4)
#> [1] NA NA NA NA 4.625
## clean up
rm(dweights)
weighted.sma(c(1, 2, 3, 4, 5),
window = 3L, decay = "none",
missThreshold = 0)
#> [1] NA NA 2 3 4
weighted.sma(c(1, 2, 3, 4, 5),
window = 3L, decay = "exponential",
alpha = 0, missThreshold = 0)
#> [1] NA NA 2 3 4
weighted.sma(c(1, 2, 3, 4, 5),
window = 3L, decay = "linear",
alpha = 0, missThreshold = 0)
#> [1] NA NA 2 3 4
weighted.sma(c(1, 2, 3, 4, 5),
window = 3L, decay = "exponential",
alpha = .1, missThreshold = 0)
#> [1] NA NA 2.070111 3.070111 4.070111
weighted.sma(c(1, 2, 3, 4, 5),
window = 3L, decay = "exponential",
alpha = .5, missThreshold = 0)
#> [1] NA NA 2.428571 3.428571 4.428571
weighted.sma(c(1, 2, 3, 4, 5),
window = 3L, decay = "linear",
alpha = .1, missThreshold = 0)
#> [1] NA NA 2.074074 3.074074 4.074074
weighted.sma(c(1, 2, 3, 4, 5),
window = 3L, decay = "linear",
alpha = .3, missThreshold = 0)
#> [1] NA NA 2.285714 3.285714 4.285714
weighted.sma(c(1, NA, NA, 4, 5),
window = 4L, decay = "exponential",
alpha = .4, missThreshold = .4)
#> [1] NA NA NA NA 4.625
## clean up
rm(dweights)